An ongoing lament of mine throughout our long global pandemic nightmare has been the fact that elected and appointed officials tasked with guiding the public have — more often than not — been a bunch of duplicitous jackasses.
In the beginning (March and April) I was willing to cut everyone some slack because we were all flying blind then. I did rant a lot back then, but I merely wanted some explanation of the rationale behind various decisions. Those who were suddenly flush with the feeling of power that comes with being petty tyrants were not willing to share such things, however. They all took a “Do as I say simply because, peasants,” attitude.
Me, being flush with a lifetime of being an American, took umbrage with that posture.
By the time we got to the end of April there was at least some data rolling in and all of the protocols that were meant to keep us safe didn’t have to be random or purely speculative. One would have thought so, anyway.
One would have been wrong.
The randomness continued, a second wave of shutdowns with suspicious criteria hit, and we began getting confirmation that not all COVID-19 info that was being offered to the public was…what’s the word I’m looking for here…oh, yeah: honest.
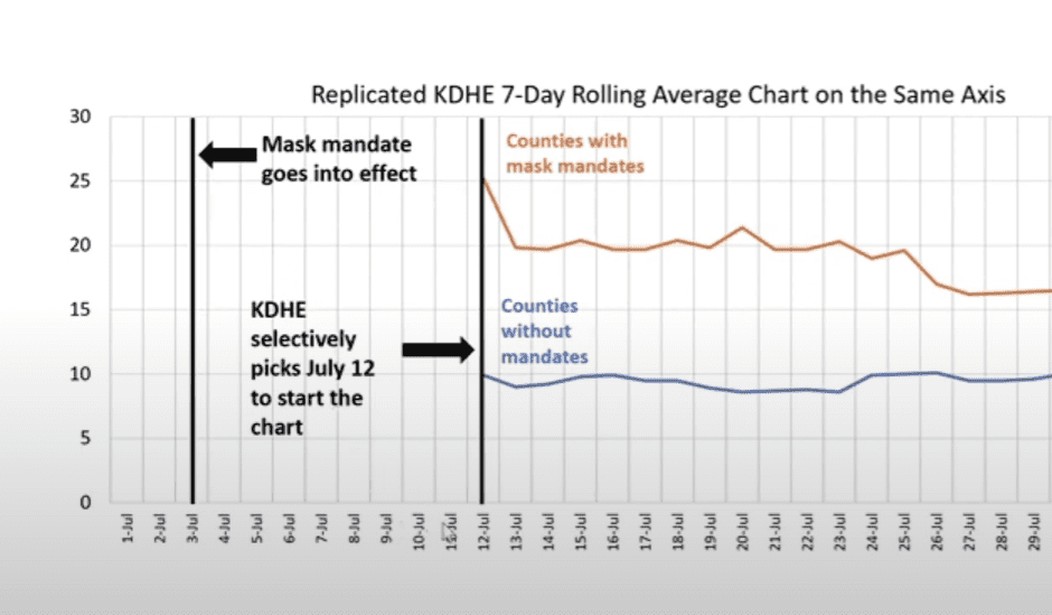
The Kansas Department of Health and Environment found the urge to be less-than-forthcoming too much to resist when it released a chart to champion mask mandate effectiveness in counties that had them.
Last week, KDHE presented a chart that appeared to show that counties with a mask mandate had fewer cases than counties without the mandates.
The KDHE strategically chose to begin the chart on July 12 even though Governor Kelly’s mandate went into effect on July 3. An Open Records request from the Sentinel’s parent company, Kansas Policy Institute, compelled KDHE to produce the data, which reveals what KDHE didn’t want reporters and citizens to know – they selectively picked the day with the peak number of cases to start showing the data.
The nine days that were hidden from the public were July 3-11, during this time the number of average daily cases per 100,000 people in the mandate counties jumped from 9.1 per day to 25.3 per day. The 7-day rolling average then dropped to 19.7 on July 13, which KDHE Secretary Dr. Lee Norman would have Kansans believe is solely attributable to a mask mandate. Not wearing a mask, mind you; a mask mandate.
There’s a little offering of an example for anyone who wonders why so many of us on the Right aren’t big fans of governmental bureaucracy.
Breaking it down: this is a governmental agency deliberately manipulating data in order to justify the government being heavy-handed with its citizens.
Here’s a video from the Kansas Policy Institute setting up just how the data was manipulated. The chart with the answer to the question posed at the end of the vid can be found here.
Fewer Lies and More Honesty Would Be Helpful in the COVID-19 Conversation
___
Kruiser Twitter
Kruiser Facebook
PJ Media Senior Columnist and Associate Editor Stephen Kruiser is the author of “Don’t Let the Hippies Shower” and “Straight Outta Feelings: Political Zen in the Age of Outrage,” both of which address serious subjects in a humorous way. Monday through Friday he edits PJ Media’s “Morning Briefing.” His columns appear twice a week.