
Lower unemployment always sounds like good news, especially when it’s what the media likes to call “historic.”
We’ve reached another “historic” moment this week, as jobless claims have fallen to their lowest level since 1969.
“Jobless claims fell by 28,000 to 187,000 for the week ending March 19, the lowest since September of 1969, the Labor Department reported Thursday,” the Associated Press said. “The four-week average for claims, which compensates for weekly volatility, also fell to levels not seen in five decades. The Labor Department reported that the four week moving average tumbled to 211,750 from the previous week’s 223,250.”
The total number of Americans seeking unemployment benefits is at a five-decade low as well.
All this news comes just after the Department of Labor also released info that businesses generated 678,000 jobs just last month — and I’m surprised that the Biden administration didn’t rush out to claim credit for every last one of them.
The AP also pointed out that January’s report of 1.3 million open jobs throughout the country is driving up wages as businesses compete to hire people, which is another contributing factor to our current inflation problem.
Related: The Flipside of Low Unemployment: 4.7 Million More Jobs Than Job-Seekers
Earlier this month, I wrote about some of the reasons behind the surplus of jobs we’re seeing in this country today: factors like the gig economy, employees moving up and seeking new opportunities, and parents staying home to homeschool their kids.
“The employment picture in this country is complex,” I wrote (see the “Related” link above). “This mixture of factors tells the tale of why we can simultaneously see a low unemployment rate side by side with millions of unfilled job openings.”
Other data gives us a fuller picture of the state of employment in the U.S. The U6 unemployment rate, which, as YCharts describes, “also includes workers that are discouraged and underemployed,” gives us a clearer picture of who’s not working because it’s not limited to people who are actively seeking employment.
The current unemployment rate is 3.8%, according to the Bureau of Labor Statistics. The U6 unemployment rate is twice as high, clocking in at 7.6%. The encouraging news is that that number is down slightly, and it’s drastically lower than the COVID-19 pandemic high of 22.4% in April 2020.
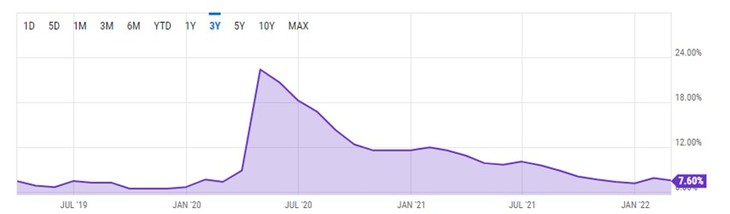
The bad news is that, when you take into account those who have given up on looking for work, the unemployment rate is twice as high.
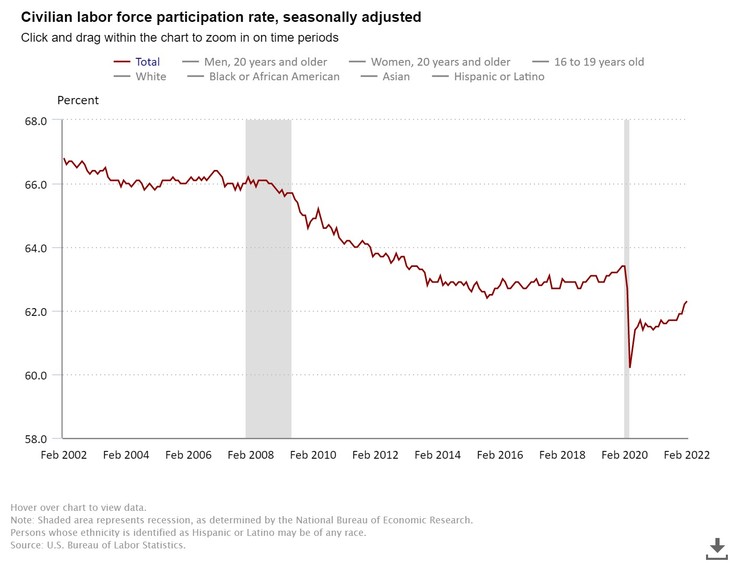
The civilian labor participation rate is another telling statistic. It stands at 62.3% as of February. Exactly 20 years before that, the rate was 66.8%.
While you can see from the chart below that the labor participation rate was decimated by the pandemic, it has grown steadily since, but it still hasn’t returned to the higher rate it was before COVID.
Looking at the data by age and gender, you’ll see similar patterns for everyone.
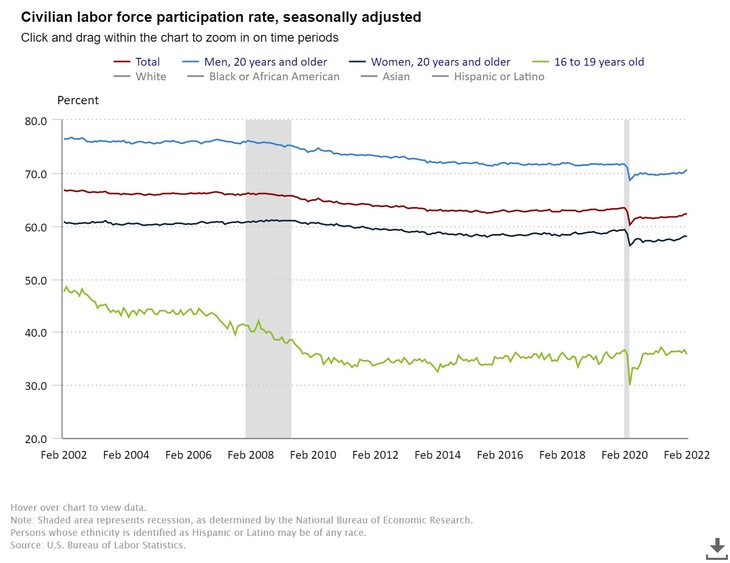
(You’ll also notice that the federal government only measures employment for two genders, but I digress.)
As I mentioned earlier, the employment picture in this country is a complex one, and the data shows that we’re still working to claw our way out of the difficulties of the pandemic.
I believe the resilient American economy can do it — especially if we can chip away at the Democrats’ dominance of government in November and elect a serious president who acts in the best interests of everyday Americans in 2024.
Let’s make it happen!


Join the conversation as a VIP Member