
The familiar items in the government’s Employment Situation Summary on Friday were bad enough:
- The unemployment rate increased for the second straight month, this time to a seasonally adjusted 9.1%.
- The seasonally adjusted number of workers employed increased by only 54,000. After taking prior-month downward revisions into account, only 15,000 more Americans were working in May than were working in April.
Both numbers were “unexpectedly” poor, even after prognosticators had two days’ warning to downwardly adjust their estimates courtesy of payroll giant ADP, whose employment report on Wednesday showed only 38,000 seasonally adjusted private-sector jobs added.
If you think that’s bad, wait until you see the real numbers.
What? Yes, I’m redundantly telling you that the numbers routinely reported out of the Bureau of Labor Statistics (BLS) do not represent what actually happened in any given month, because they, as already noted, are seasonally adjusted.
To be clear, I’m not accusing BLS of cooking the books, and there’s nothing wrong with seasonally adjusting data. Doing so is a time-honored statistical technique for smoothing out information which fluctuates throughout the year. From all appearances, the methodology BLS uses to generate its seasonally adjusted data is statistically valid and has been consistently applied. In my view, despite the limited value of seasonally adjusted data in the current economic environment, I don’t want the bunch currently in the White House to get anywhere near the idea of revising how things are done (and no, I don’t believe they’ve had a chance to corrupt the process yet, though it could be a second-term agenda item).
In normal times, it’s usually acceptable for data users to stick with seasonally adjusted (SA) information while avoiding the adventure of delving into and analyzing the raw, not seasonally adjusted (NSA) stuff. But these are not normal times. We’re at the three-year point of the POR (Pelosi-Obama-Reid) economy, an appellation I applied in early July 2008, when I recognized that the economy was fundamentally changing, and not for the better. In abnormal times such as these, you cannot be sure that the SA data adequately reflects what’s happening in the raw NSA information.
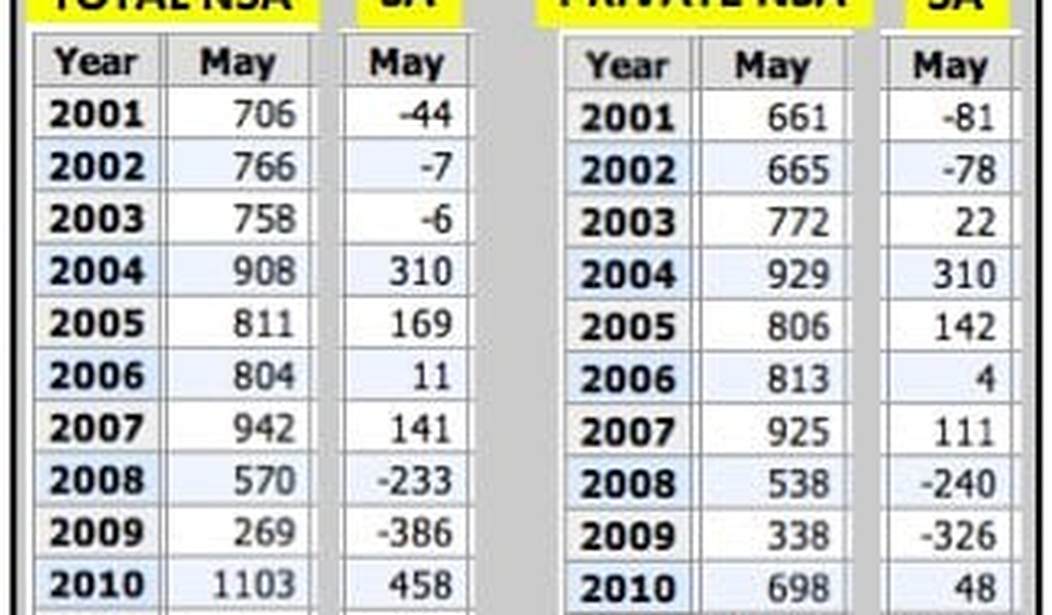
The following chart showing NSA and SA job additions and losses in the month of May during the past 11 years, both overall and in the private sector, will demonstrate the raw data’s current importance:

Going all the way back to 1955, May has been a month when net employer hires have been positive, usually by a large amount. Heavy-hiring months like March, April, and May make up for ones like January and July, when the workforce usually significantly contracts.
This year’s figure for overall May 2011 job additions may look almost acceptable at first, but it really isn’t. Except for May 2008, the eve of the POR economy, and May 2009, near the end of the recession, the May 2011 figure is the lowest on the list — during what is supposed to be a recovery. May 2011 is probably still worse than May 2010 even after reducing last year’s figure by roughly 400,000 census workers. Does anyone remember the economy being great in May last year? I didn’t think so.
Something got lost in this year’s (and, for that matter, last year’s) seasonal translation. It’s quite logical to ask how 682,000 NSA jobs can turn into 54,000 SA jobs, when in 2008, 112,000 fewer NSA jobs (682K minus 570K) generated 287,000 fewer SA jobs (the difference between +54K and -233K) and a huge net job loss. Also note that 2001, 2002, 2003, and 2006 all had higher actual NSA job growth that still resulted in lower SA job additions than May 2011.
The problem is that the May 2008 and especially the May 2009 raw values, which were so out of whack compared to previous years, were by design (again, validly per the BLS’s methodology) given significant weight in this year’s seasonal adjustment process. The reality remains, however, that this year’s May NSA number is, with one tiny exception in 1991, worse than every other May between 1982 and 2007.
Similarly, May 2011’s NSA figure of 723,000 generated seasonally adjusted private-sector additions of 83,000, even though May 2007 had 202,000 more NSA jobs (925K minus 723K) but only a barely higher 111,000 after seasonal adjustment. Though the raw private-sector figure for May 2011 is more impressive than its total economy counterpart, it’s still less than every year from 2003 through 2007 — years during which the establishment press was always telling us what a mediocre economy we were supposedly enduring.
It should be clear that if the economy in May 2007 had generated the raw overall and private-sector job additions seen in May 2011, both seasonally adjusted results would have been negative. Thanks to looking past the statistically valid but distracting seasonal adjustments and diving into the raw data, we see that May 2011’s results were far worse than reported. In the 23rd month after the recession ended, despite the obvious availability of millions of unemployed workers, the economy has suddenly gone to generating jobs at a rate that is nowhere near what occurred during 2003 through 2007.
With stubbornly high gas prices, over-regulation, crippling uncertainty, and an administration indifferent and often hostile towards job growth, it’s hard to see things getting much better in the near term. Yet the establishment press won’t let go of the idea that we’re still in an economic recovery. My question remains the same as it was in early 2010: “Rebound? What Rebound?“


Join the conversation as a VIP Member