

[NOTE: For my latest updates on Hurricane Sandy, follow me on Twitter.]
As I did with Irene and Isaac, I thought it would be helpful to create a “one-stop shop” of live data about Hurricane Sandy, so you can track everything in one place as the storm moves ashore.
For the sake of everyone’s browsers and processors, I’ll split this post up into multiple pages/sections by type of image (tidal gauges, satellite, radar, etc.). But if you think your computer can handle it, you can view everything on one page here.
The pages/sections are:
• Tidal Gauges
• Satellite Maps
• Radar Maps
• Wind, Pressure & Wave Heights
Here’s a quick sampling of the sort of images on those pages/sections of this post:
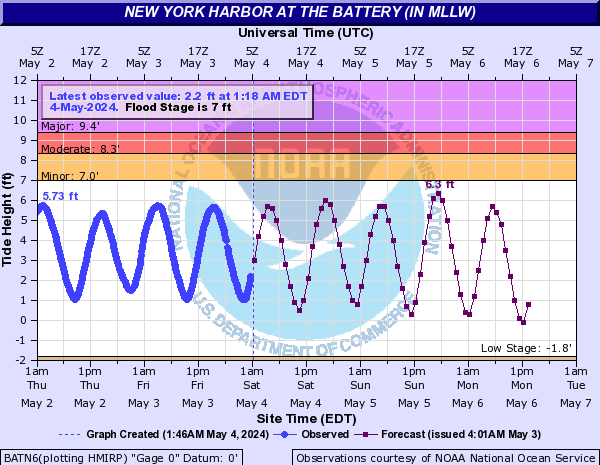
Tidal Gauge at The Battery, New York, NY:
(NOTE: The main Battery Park tidal gauge display is having on-again, off-again issues. If the above image is blank, try this backup. Remember: the storm surge is the green line, i.e., the red “Observed Height” minus the blue “Predicted Height.”)


Wind & Pressure, Cape May, NJ:
Also, I’m not going to embed them all in this post, but you may want to check out these webcams, as well as this webcam with sound from the torch of the Statue of Liberty.
Anyway… on with the “one-stop shop.” I’ll start with tidal gauges. Again, click here to view everything on one page.
TIDAL GAUGES
These are mostly courtesy NOAA Tides and Currents. By way of explanation/reminder:
• The blue line is the expected, “normal” water level, as the tides come in and out. Basically, it’s what the tides would be without Isaac.
• The red line is the actual observed water level. When you see the red line not declining, or only declining slightly, while the blue line is going way down, that’s bad news. It means the storm surge is preventing the tide from going out, so the next high tide will likely be much higher (assuming the surge is still present when the tide comes in).
• The green line is the “residual” level, i.e., the difference between the red and blue lines. Basically, the green line is the storm surge. So, for instance, if the red line is declining as the tide goes out, but not as much as it “should” be declining (as in the scenario just discussed), that will cause the green line to go up.
Chesapeake Bay Bridge Tunnel, VA
Windmill Point, VA (in Chesapeake Bay)
Lewes, DE (south side, mouth of Delaware Bay)
Brandywine Shoal Light, DE (middle of Delaware Bay)
Cape May, NJ (north side, mouth of Delaware Bay)
Sandy Hook, NJ (mouth of New York Harbor)
Another View of Sandy Hook, NJ:

Bergen Point, NY (north shore of Staten Island)
The Battery, NY (Lower Manhattan)
[NOTE: If the above graphic isn’t working, try this view of The Battery data.]
Yet another view of The Battery, NY:
Kings Point, NY (north shore of western Long Island)
Another view of Kings Point, NY:

Hudson River below Poughkeepsie, NY


Inwood, NY (south shore of Long Island)

Freeport, NY (south shore of Long Island)

Lindenhurst, NY (south shore of Long Island)

Bridgeport, CT (on Long Island Sound)
New Haven, CT (on Long Island Sound)
New London, CT (on Long Island Sound)
Montauk, NY (north side, facing Long Island Sound)
Additional tidal gauges in Delaware Bay / Delaware River:
SATELLITE MAPS


Storm close-up: Visible (daytime) / Non-Enhanced Infrared (nighttime)

Storm close-up: Enhanced Infrared (RBTOP)
RADAR (precipitation falling now)


RADAR (storm total precipitation)


BUOY DATA – WIND / PRESSURE
Open water east of Ocean City, MD
~100 miles south of Long Island
(NOTE: This is not an official NOAA buoy, and it’s not clear if the data is accurate. It has shown some wind gusts that seem implausibly high.)
~35 miles south of Long Island
Robins Reef, NJ (in NY harbor)
BUOY DATA – WAVE HEIGHT
Open water east of Ocean City, MD
WIND & PRESSURE DATA
GREAT LAKES BUOYS – WAVE HEIGHTS


Join the conversation as a VIP Member