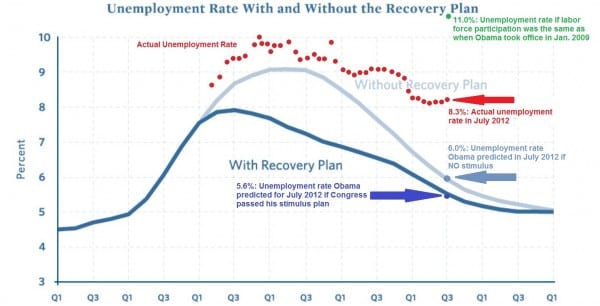
FOUR YEARS AGO IS LOOKING PRETTY GOOD: Investor’s Business Daily: Better Off? Let’s Count the Ways We’re Not.
By most measures the country isn’t making slow progress; it’s falling further behind. Some examples:
• Median incomes: These have fallen 7.3% since Obama took office, which translates into an average of $4,000. Since the so-called recovery started, median incomes continued to fall, dropping $2,544, or 4.8%.
• Long-term unemployed: More than three years into Obama’s recovery, 811,000 more still fall into this category than when the recession ended.
• Poverty: The poverty rate climbed to 15.1% in 2010, up from 14.3% in 2009, and economists think it may have hit 15.7% last year, highest since the 1960s.
• Food stamps: There are 11.8 million more people on food stamps since Obama’s recovery started.
• Disability: More than 1 million workers have been added to Social Security’s disability program in the last three years.
• Gas prices: A gallon of gas cost $1.89 when Obama was sworn in. By June 2009, the price was $2.70. Today, it’s $3.84.
• Misery Index: When Obama took office, the combination of unemployment and inflation stood at 7.83. Today it’s 9.71.
• Union membership: Even unions are worse off under Obama, with membership dropping half a million between 2009 and 2011.
• Debt: Everyone is far worse off if you just look at the national debt. It has climbed more than $5 trillion under Obama, crossing $16 trillion for the first time on Tuesday and driving the U.S. credit rating down.
Ironically, the only people better off under Obama are corporate chieftains, who’ve seen corporate profits climb more than 50% under Obama’s “recovery,” and investors, who’ve benefited from a near-doubling in the Dow industrials from its March 2009 lows.
Given this record, we can only hope Obama doesn’t have the chance to get a “complete” on his plans.
Indeed. Oh, what the hell, let’s run that graphic again:

